Network-Sci Example Network & Analysis
The Network
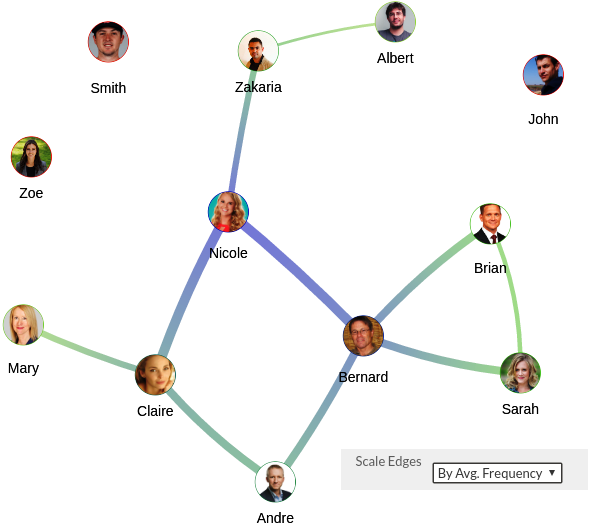
The network used in this example represents a social network connecting friends (the choice of
names and pictures was random).
Each node represents a person and the nodes are grouped according to the people’s jobs.
The links represent the « Friends with » relationship.
Each node represents a person and the nodes are grouped according to the people’s jobs.
The links represent the « Friends with » relationship.
The Network Analysis
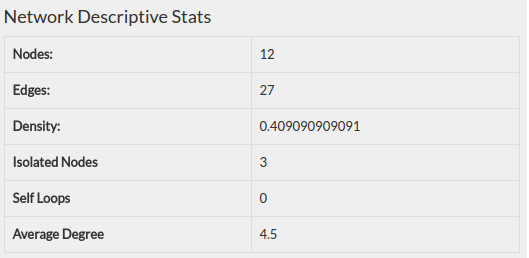
The network has 12 nodes (3 isolated), 27 links and a density value of 0.409.
The person who has most friends in this network is Bernard with a node degree of 4 and a P(i)
coefficient of 0.7 , closely followed by Claire and Nicole with a node degree of 3 and a P(i) coefficient
0.6 .
The persons with the least number of friends are Smith, John and Zoe with a node degree of 0 and a
P(i) coefficient of 0 . Knowing the fact that these persons are actually gamers and tend to be isolated,
it won’t be absurd to assume that they don’t have many friends (at least in this network).
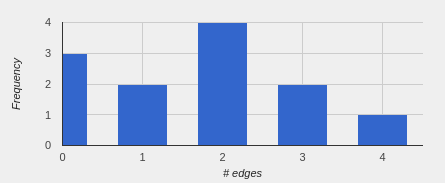
The next table (Figure 3) displays the degree summary of our network, while the histogram in Figure
4 displays the degrees’ frequencies.
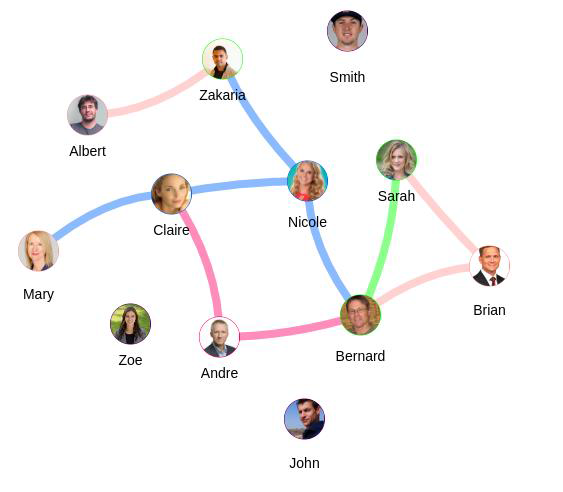
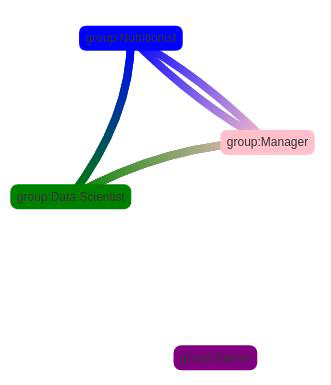
The graph is clustered into four groups (Figure 5) : Data Scientist, Gamer, Nutritionist and Manager.
Network-Sci Plateform Obervations VS Bugs to be fixed
Observations
- The viewer is easy to use.
- The tools are accessible..
- Creating deleting and updating nodes is easy.
- Image uploading is nice.
- Staring with a clustered graph is nice.
- The project management is good but can be better.
- The low opacity part is great.
Bugs to be fixed
- There’s no file upload. We should be able to upload JSON, CSV, etc… files with graph
data on them.
- The group color choice should not be a text field.
- The CSS of the range bars should be corrected (borderWidhth, size, etc…).
- The app tends to block from time to time.
- Going from the clustered to the detailed graph tends to bug.
- Once the project is safe, we need to go back to a home page or something.
- What is the purpose of « Info Single Node » ?
- Why are the names clickable in the degree summary of the clustered graph ?
- The project publishing is not working.
- The zoom is not working.
More suggestions
- Going from and to the different interfaces should be smoother.
- There should be a better session management.
- The project management could be better either by being able to navigate throughout the projects or going back to the current project after saving or updating it.
- The densities part should more clear.
- The node creation (Geometrics & Topology) part should be inactive if we already have a graph on the viewer.
- Instead of an Info tab, we may think about having a tooltip card that will have more information about a node we hover.
- The clustering should be more interactive.
- Did you consider the evolution of the graph ?
Network-Sci Tutorial
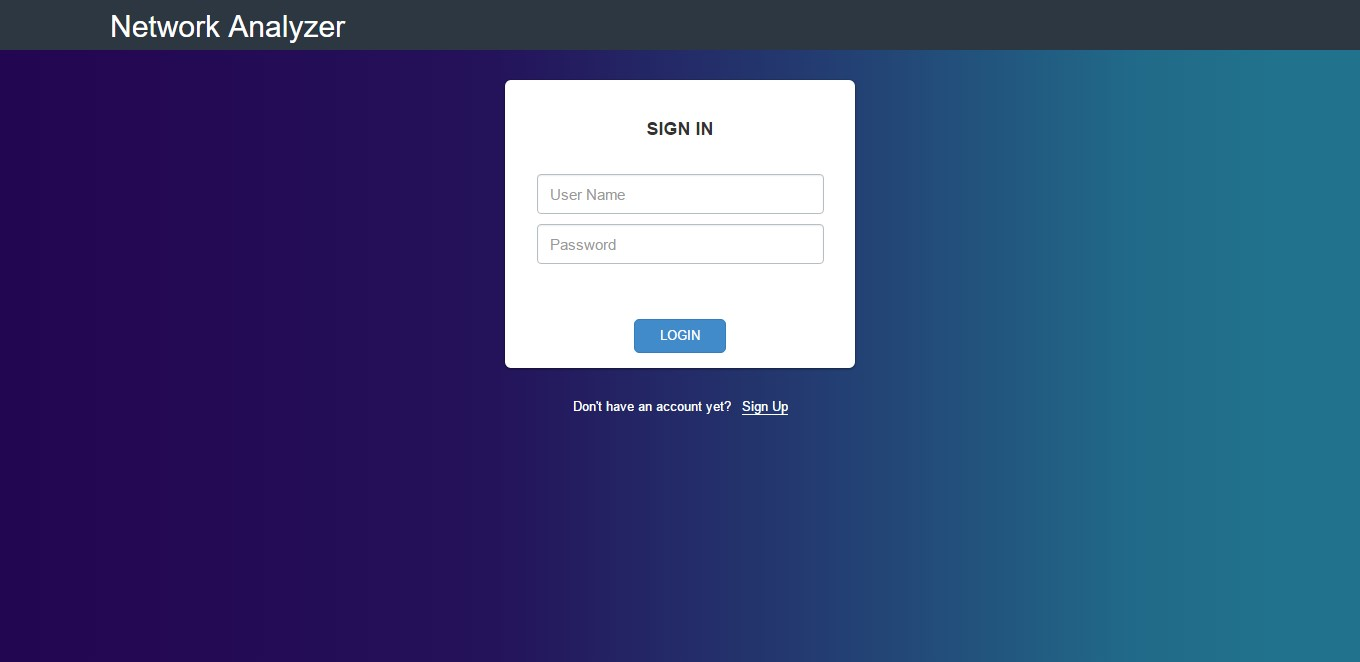
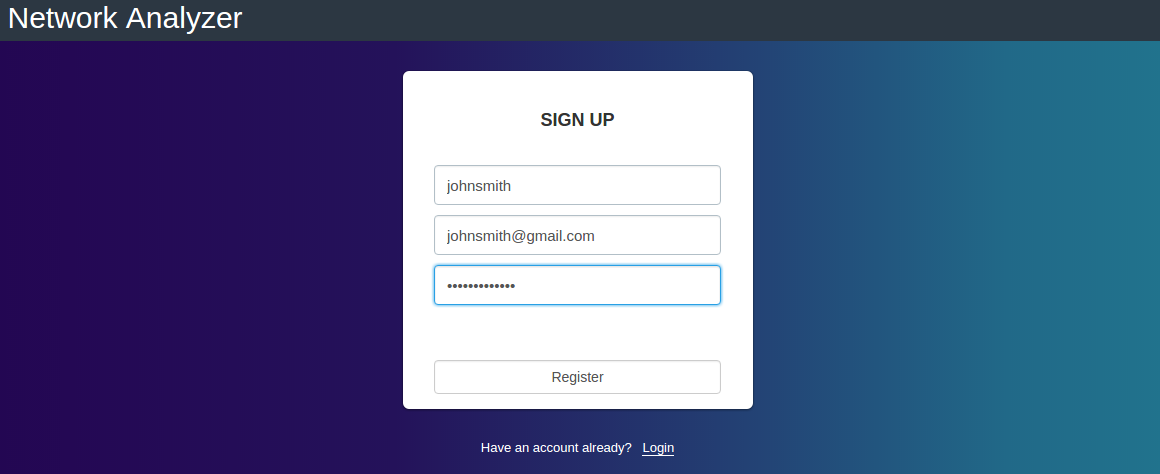
Register
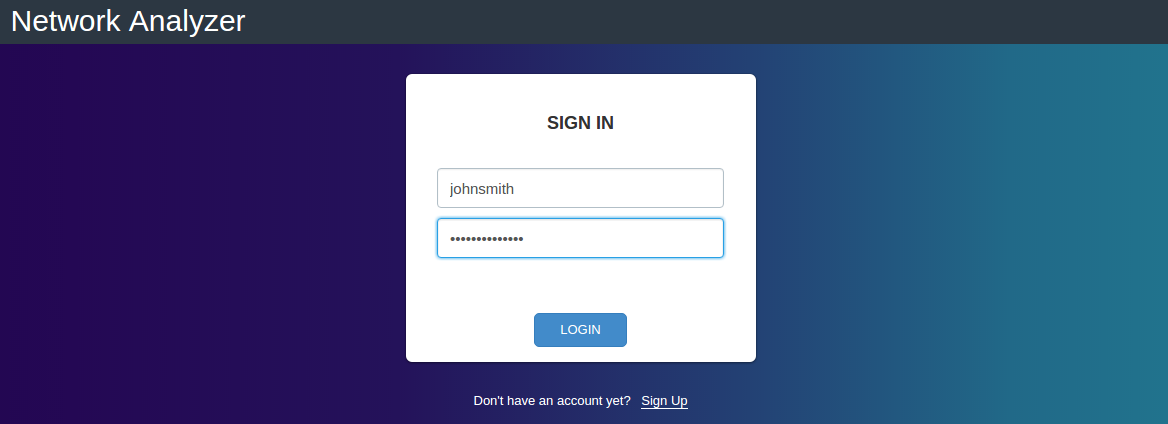
Login
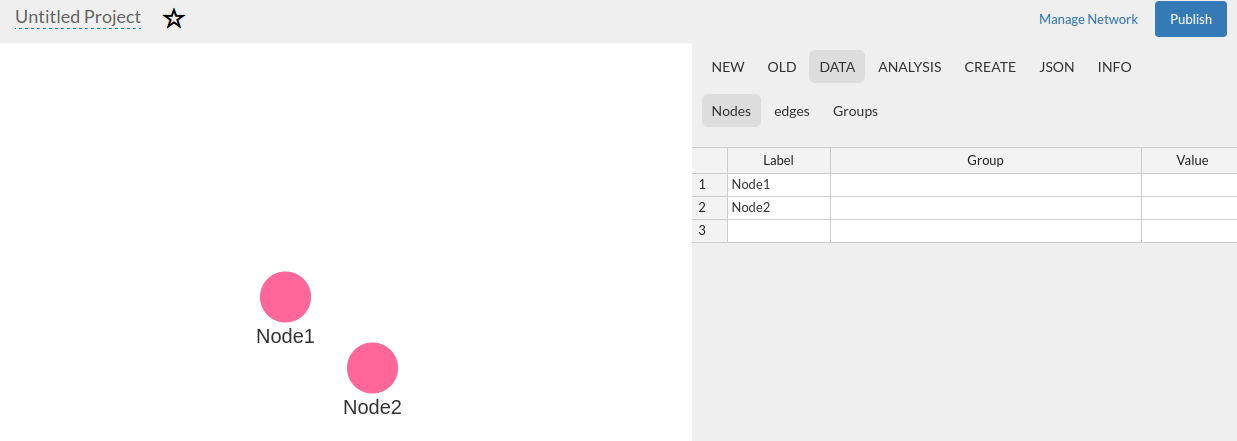
Create Nodes
- Click the « + » button on the left sidebar
Or :
- Go to the tab « Data Nodes »
- Fill the table
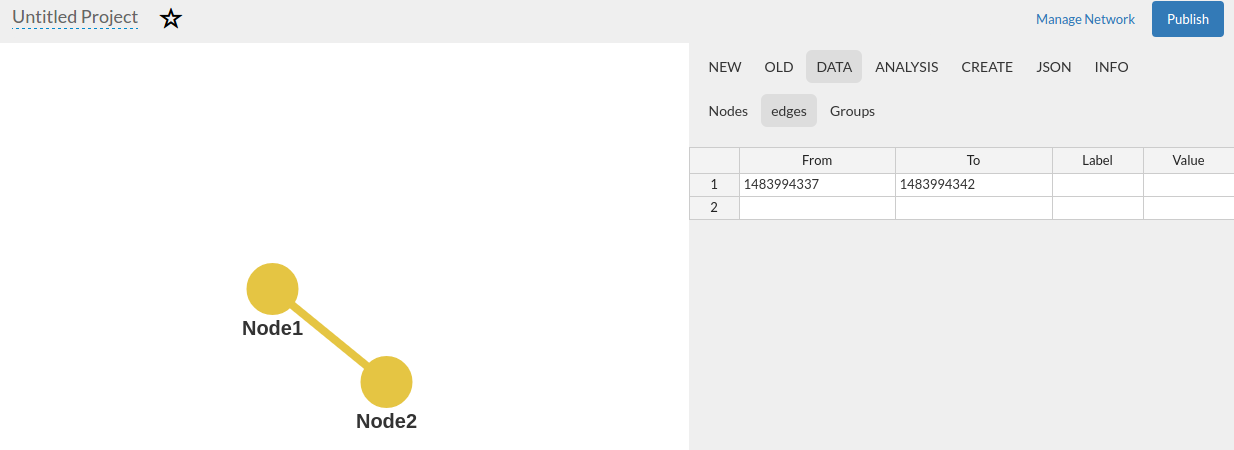
Create Edges
- Create at least two nodes
- Hold « Ctrl » button and select both nodes
- Click the « / » button on the left sidebar
Add Data to Nodes
- Double-click a node on the viewer
- Update the label
- Select Image upload type
- Select the Image path
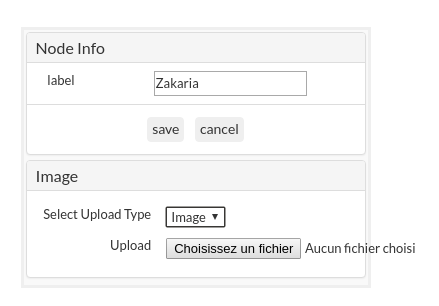
Figure 10 - Update Nodes
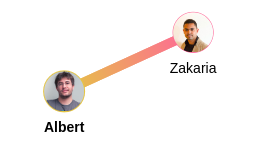
Figure 11 - Updated Nodes
Highlight Neigbours
- Select « Op » on the leftside bar
- Click a node on the viewer
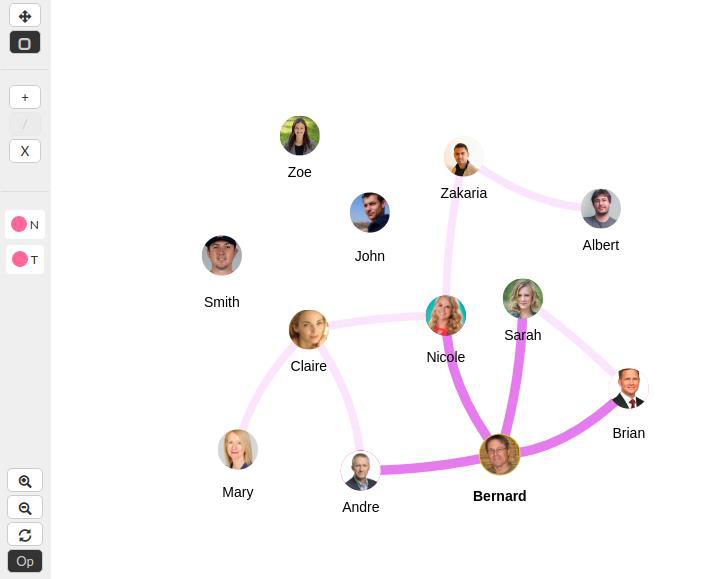
Figure 12 - Highlight Neighbours
Nodes Display Options
- Go to New Nodes
- Select « Show » to display the nodes on the network tabs. Or unselect it to display links only.
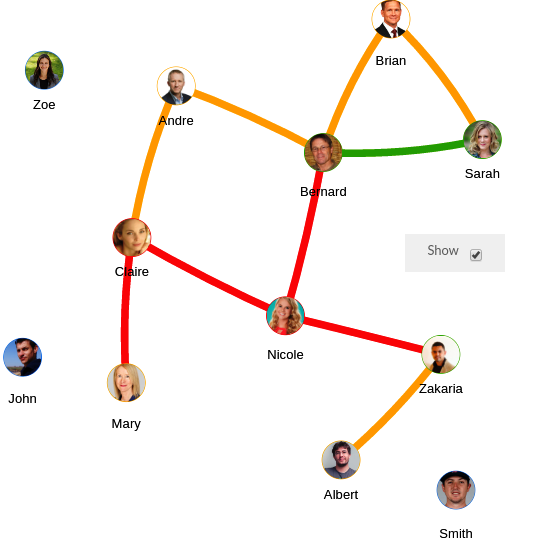
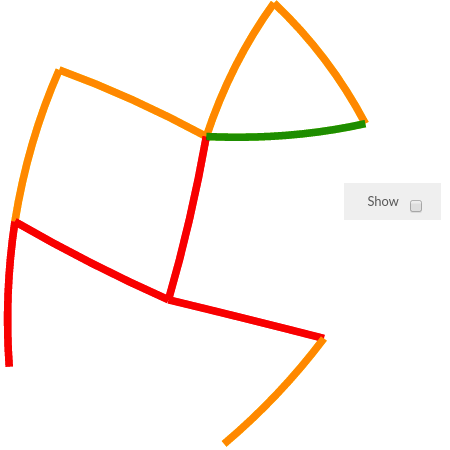
Figure 13 - "Show" is selected Figure 14 - "Show" is unselected
Set Nodes Size
- Go to New Nodes
- Set a value for « Minimum Node Size ».
- Set a value for « Maximum Node Size ».
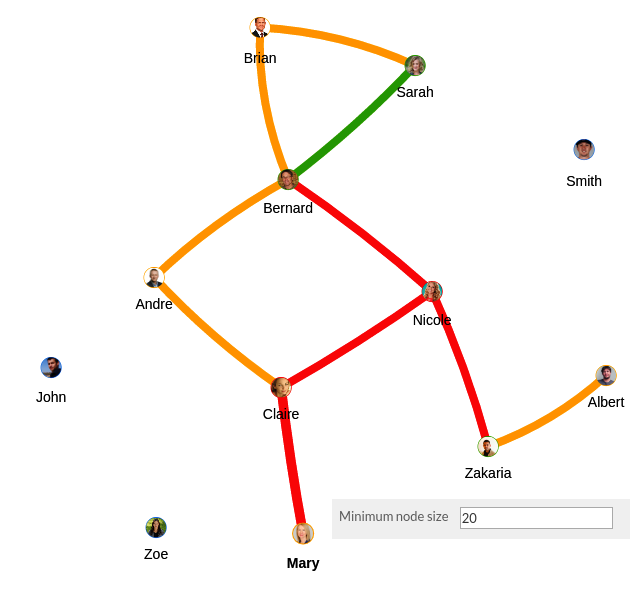
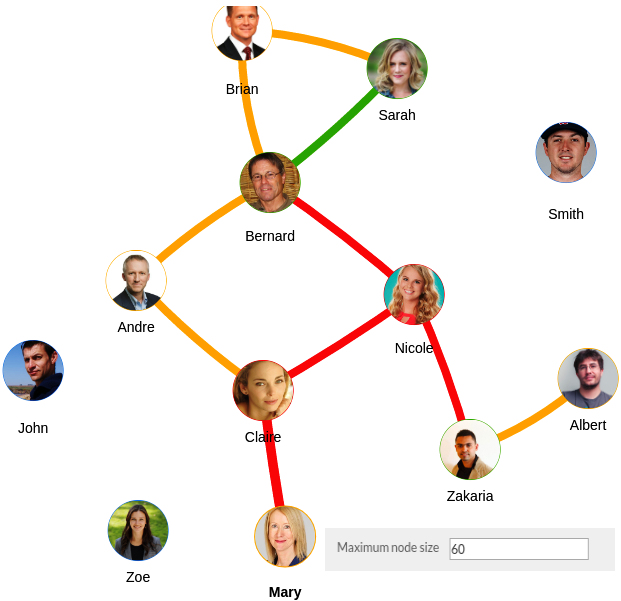
Figure 15 - Min Node Size set to 20 Figure 16 - Max Node Size set to 60
Scale Nodes
- Go to New Nodes
- Select the scale you want for the nodes. You can scale nodes by :
- Value
- Frequency
- P(i)
- Clustering Coefficient
- Closeness Centrality
- Uniform (Default)
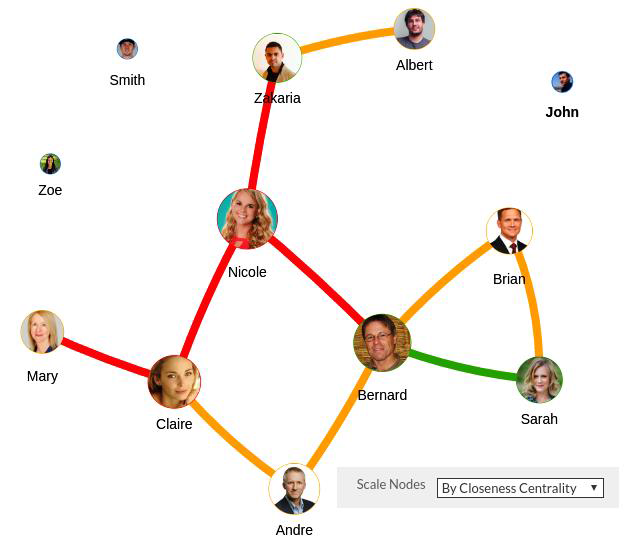
Figure 17 - Nodes Scaled by Closeness Centrality
Scale Nodes Labels
- Go to New Nodes
- Select the scale you want for the node labels. You can scale node labels by :
- Value
- Frequency
- P(i)
- Clustering Coefficient
- Closeness Centrality
- Uniform (Default)
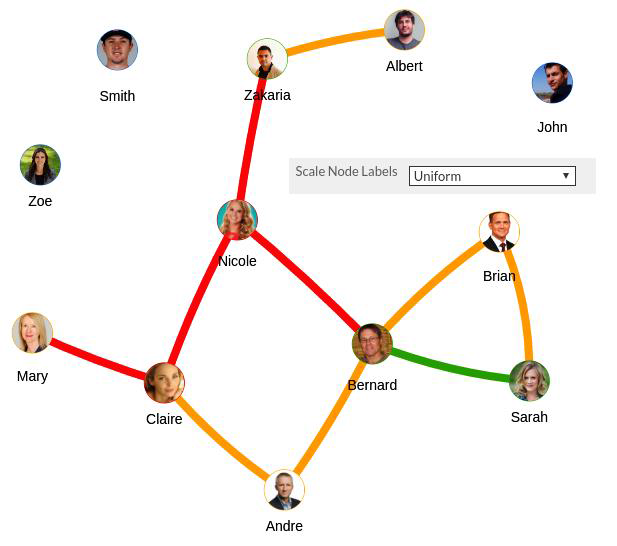
Figure 18 - Node Labels Uniformly Scaled
Nodes Coloring
- Go to New Nodes
- Select the coloring scale you want for the node labels. You can scale the nodes colors by :
- Value
- Frequency
- P(i)
- Clustering Coefficient
- Closeness Centrality
- Uniform (Default)
- Choose the number of color variations you want to have (ranging from 2 to 5)
- Select the colors you want for your scaling
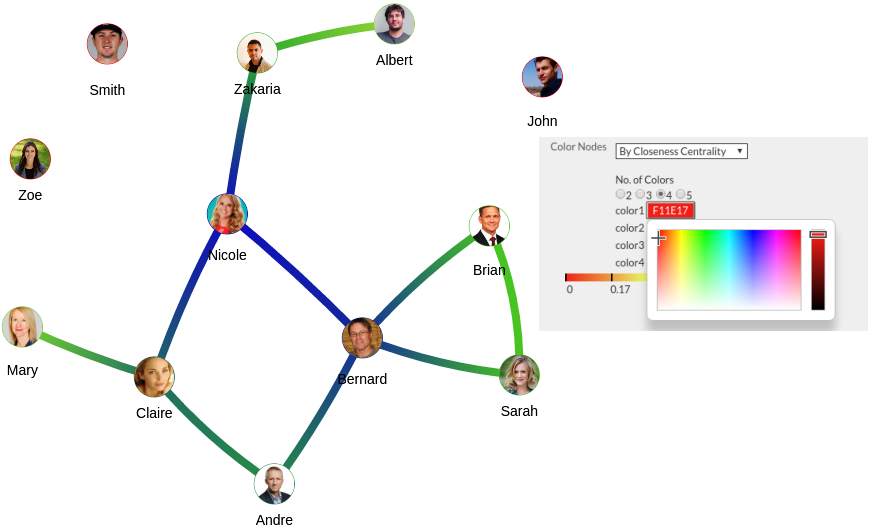
Figure 19 - Nodes Colored by Closeness Centrality
Edges Color Opacity
- Go to New Edges
- Scale the color opacity of the edges using the range bar
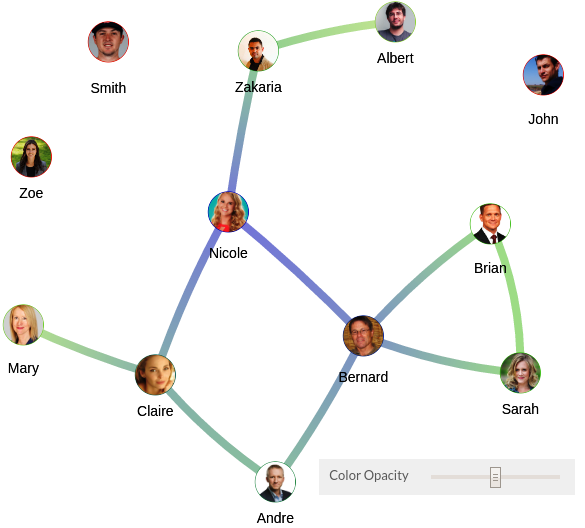
Figure 20 - Edges Color Opacity set to mid
Edges Display Options
- Go to New Edges
- Select « Show Edges » to display the edges on the network tabs. Or unselect it to display nodes only.
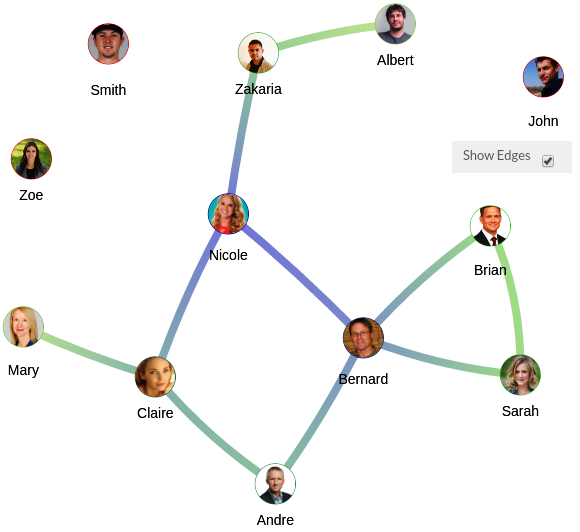
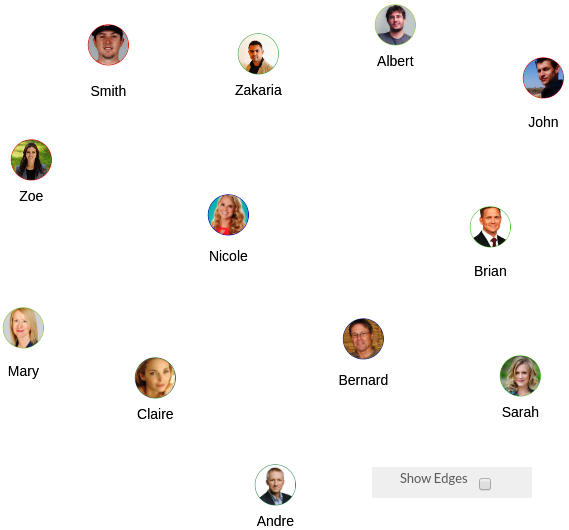
Figure 21 - "Show Edges" is selected Figure 22 - "Show Edges" is unselected
Scale Nodes
- Go to New Edges
- Select the scale you want for the edges. You can scale edges by :
- Value
- Average Frequency
- Uniform (Default)